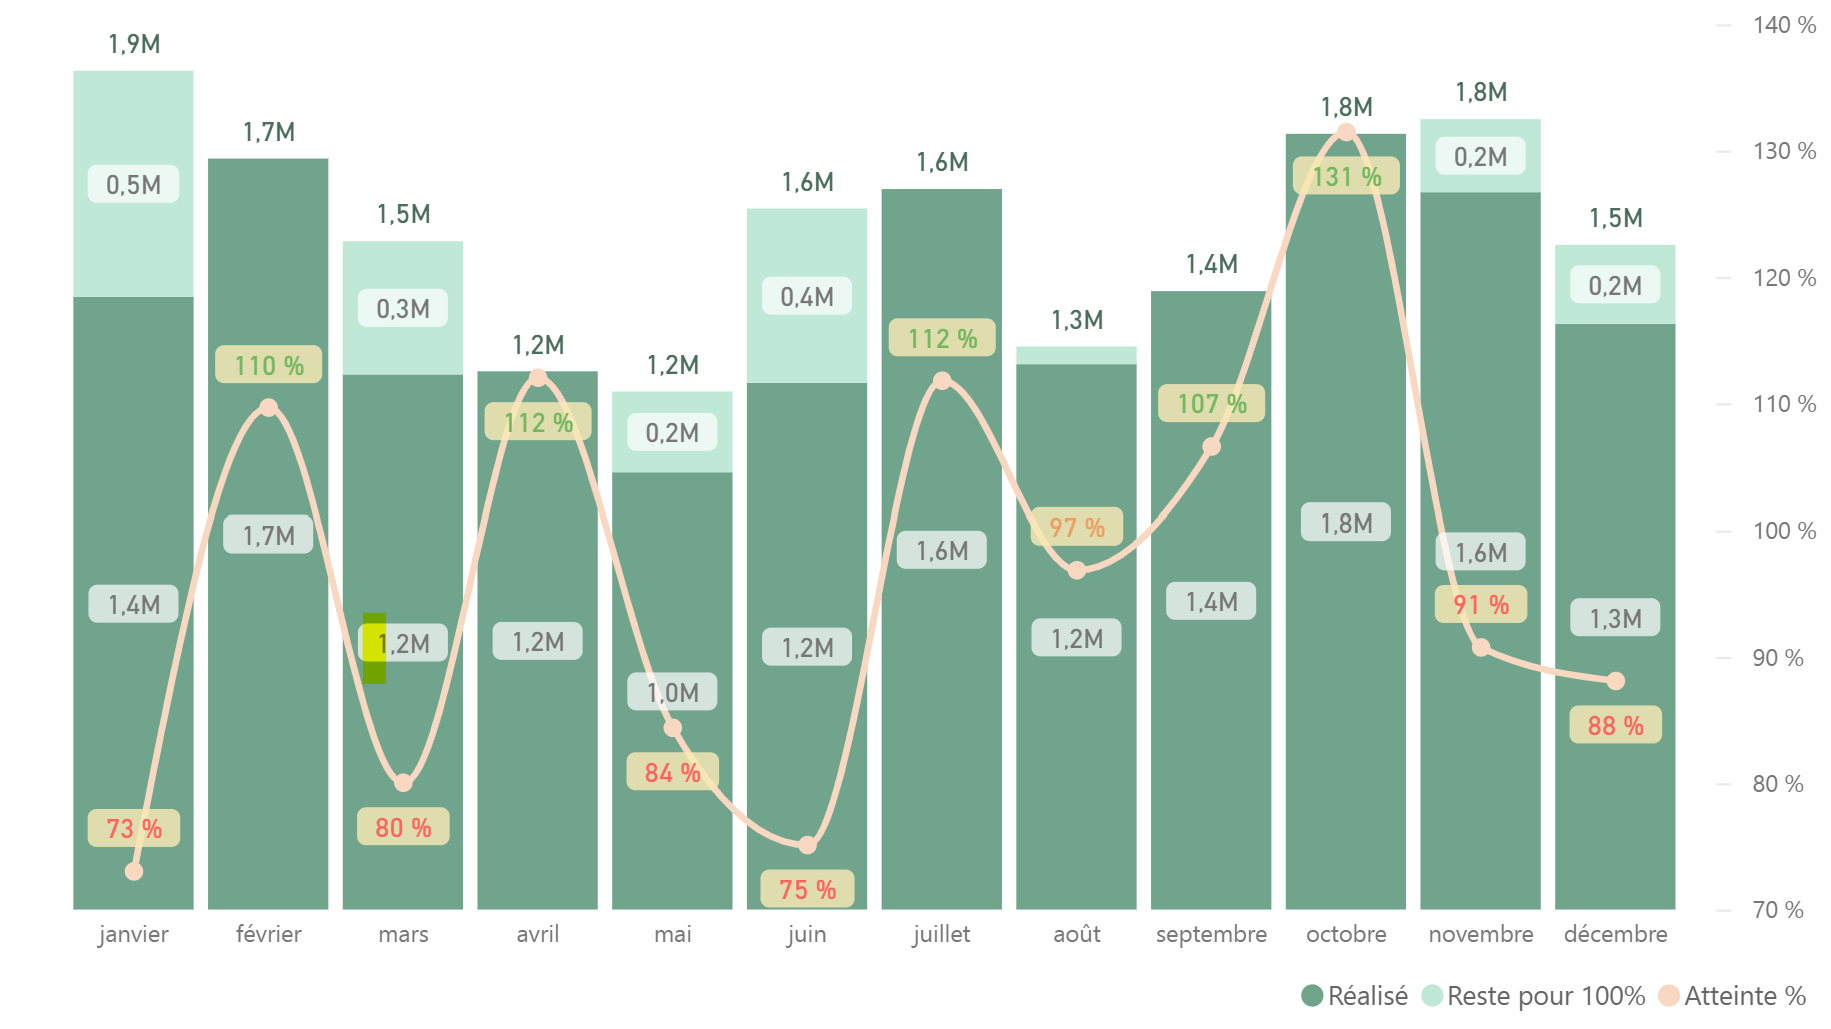
DATA VISUALIZATION :
Growth Strategy
Modern businesses are flooded with data from a multitude of sources: ERP, accounting, CRM, websites and networks, or even human resources management... Every interaction, transaction, or operation generates new information. However, the real challenge for companies lies not only in accumulating this data but in utilizing it effectively.
Why Data Visualization is
Essential
Without a clear vision, this data risks remaining underutilized, scattered across different silos. Too often, companies struggle to identify key metrics to effectively drive their growth. A decision made based on assumptions or unconsolidated data can lead to significant losses in time, resources, and opportunities.


Accessibility & Clarity
It simplifies the complexity of data by making it more accessible and understandable.
Collaboration & Alignment
Shared dashboards facilitate communication between teams and ensure a common understanding of data, leading to collective and aligned decision-making.
Action & Reactivity
Dynamic charts transform information into a strategic lever, promoting decisions based on concrete facts.
Anticipation & Forecasting
Thanks to predictive analytics, data visualization allows you to anticipate trends and optimize your strategies based on market developments.
Coherent Overview
Thanks to interactive tools, it allows for the connection of different data sources for a comprehensive view of key indicators.
Optimized Decision Making
By cross-referencing financial, commercial, HR, and customer data in real-time, it facilitates the identification of opportunities and risks.

From Data to Action: Dashboards that Make a Difference
Whether it's analyzing market trends, tracking performance indicators, or anticipating strategic decisions, our dashboards provide tangible added value to your organization. By connecting all the verticals of your business—finance, marketing, HR, logistics, and more—our Data Visualization tools empower you to drive your growth in an increasingly data-driven world.
What an Operational Dataviz Can Bring ?
Identify Trends
Detect positive trends or warning signs to anticipate and act with
Enhance Collaboration
Share real-time insights with your teams and make informed collective decisions.
Simplify Complexity
simple and intuitive tools to explore complex data without requiring advanced technical skills
Drive Effectively
track your key KPIs accurately and implement immediate actions to achieve your strategic goals
An essential tool, a decisive asset in your growth strategy
With 4SeeDS, data visualization becomes more than just a tool: it becomes a strategic lever to transform your data into informed decisions and allows you to see your daily environment from a new perspective. This pragmatic vision is clearly shared during a board meeting or a presentation to your suppliers. Thus, your strategies will convince, perceived as relevant responses.
